
Customer engagement metrics measure how customers interact with your business across the entire journey. They tell you if people are satisfied, if they're coming back, and if they’re likely to leave.
Most teams track first response time and ticket volume. Those metrics are easy to measure, but they don't tell the full story. You can respond in 30 seconds and still deliver a terrible experience if the answer is wrong or the customer has to repeat themselves four times.
This article will introduce the customer engagement metrics that actually predict retention, satisfaction, and long-term value.
First Response Time: Speed Alone Isn't Enough
First response time measures how long a customer waits for an initial reply. It matters because modern customers expect fast answers. Research shows that responding within five minutes makes you 100 times more likely to connect with a lead and 21 times more likely to qualify that lead than waiting 30 minutes.
But speed without quality is meaningless. A fast, useless reply is worse than a slightly slower, helpful one. The real metric to watch is whether the first response actually starts moving the conversation toward resolution. If customers have to ask the same question twice, your first response time is hiding a bigger problem.
Mean Time to Resolution: The Metric That Actually Matters
Mean time to resolution (MTTR) tracks how long it takes to fully solve a customer’s problem from the moment they first reach out. This is the metric that correlates most directly with customer satisfaction.
A short first response time with a long MTTR means customers get an initial reply quickly but still wait days for a solution. That’s not a good experience. It’s like being told help is on the way, then watching it never arrive.
MTTR matters because customers don’t care about your internal processes. They care about whether their problem gets fixed. A logistics company, Guanya International, faced this challenge with its existing customer service system. After deploying AI-powered tools, the company achieved faster inquiry routing, automated knowledge support, and significant labor cost reduction. When resolution times drop, satisfaction rises and retention improves.

Customer Satisfaction Score: What It Really Reveals
Customer satisfaction score (CSAT) measures how happy customers are with a specific interaction. It’s typically collected through a post-resolution survey asking, “How would you rate your experience?”
CSAT on its own tells you whether a customer was satisfied. But it doesn‘t tell you why. A customer can be satisfied with a single interaction while still being frustrated with your overall service. That’s why CSAT needs to be tracked alongside resolution time and effort scores.
A smart home device company faced fragmented service channels — over 20 different platforms for customer inquiries. Agents constantly switched between systems, and response times suffered. After consolidating channels into a unified ticket system, the company achieved a 99.2 percent ticket SLA and real-time service across 15 languages. That level of consistency drives CSAT up and keeps customers coming back.
Customer Retention Rate: The Ultimate Engagement Metric
Customer retention rate measures how many customers stay with your business over a given period. This is the metric that connects customer service performance directly to revenue.
Poor service drives churn. When customers don‘t feel supported, they leave. And when retention drops, you have to spend more on acquisition just to stay flat. That’s why leading businesses treat customer service as a growth driver, not a cost center.
Every time a customer has to repeat information across channels, resolution takes longer, and their frustration grows. That frustration eventually leads to churn. A unified ticket system prevents this by maintaining a complete history of every interaction across email, chat, and phone calls. Agents see the full picture instantly, and customers don‘t have to repeat themselves.
How These Metrics Work Together
The table below shows how these metrics interact and what they reveal about your service operation.
| Metric | What It Measures | Red Flag | Healthy Sign |
| First response time | Speed of initial reply | Fast but unhelpful responses | Fast and moves toward resolution |
| MTTR | Time to full resolution | Long delays after first reply | Consistent decrease over time |
| CSAT | Satisfaction with interaction | High scores but low retention | Scores trend up with resolution speed |
| Retention rate | Customer loyalty over time | Rising churn despite good service | Stable or improving over quarters |
Where Engagement Metrics Meet Efficiency
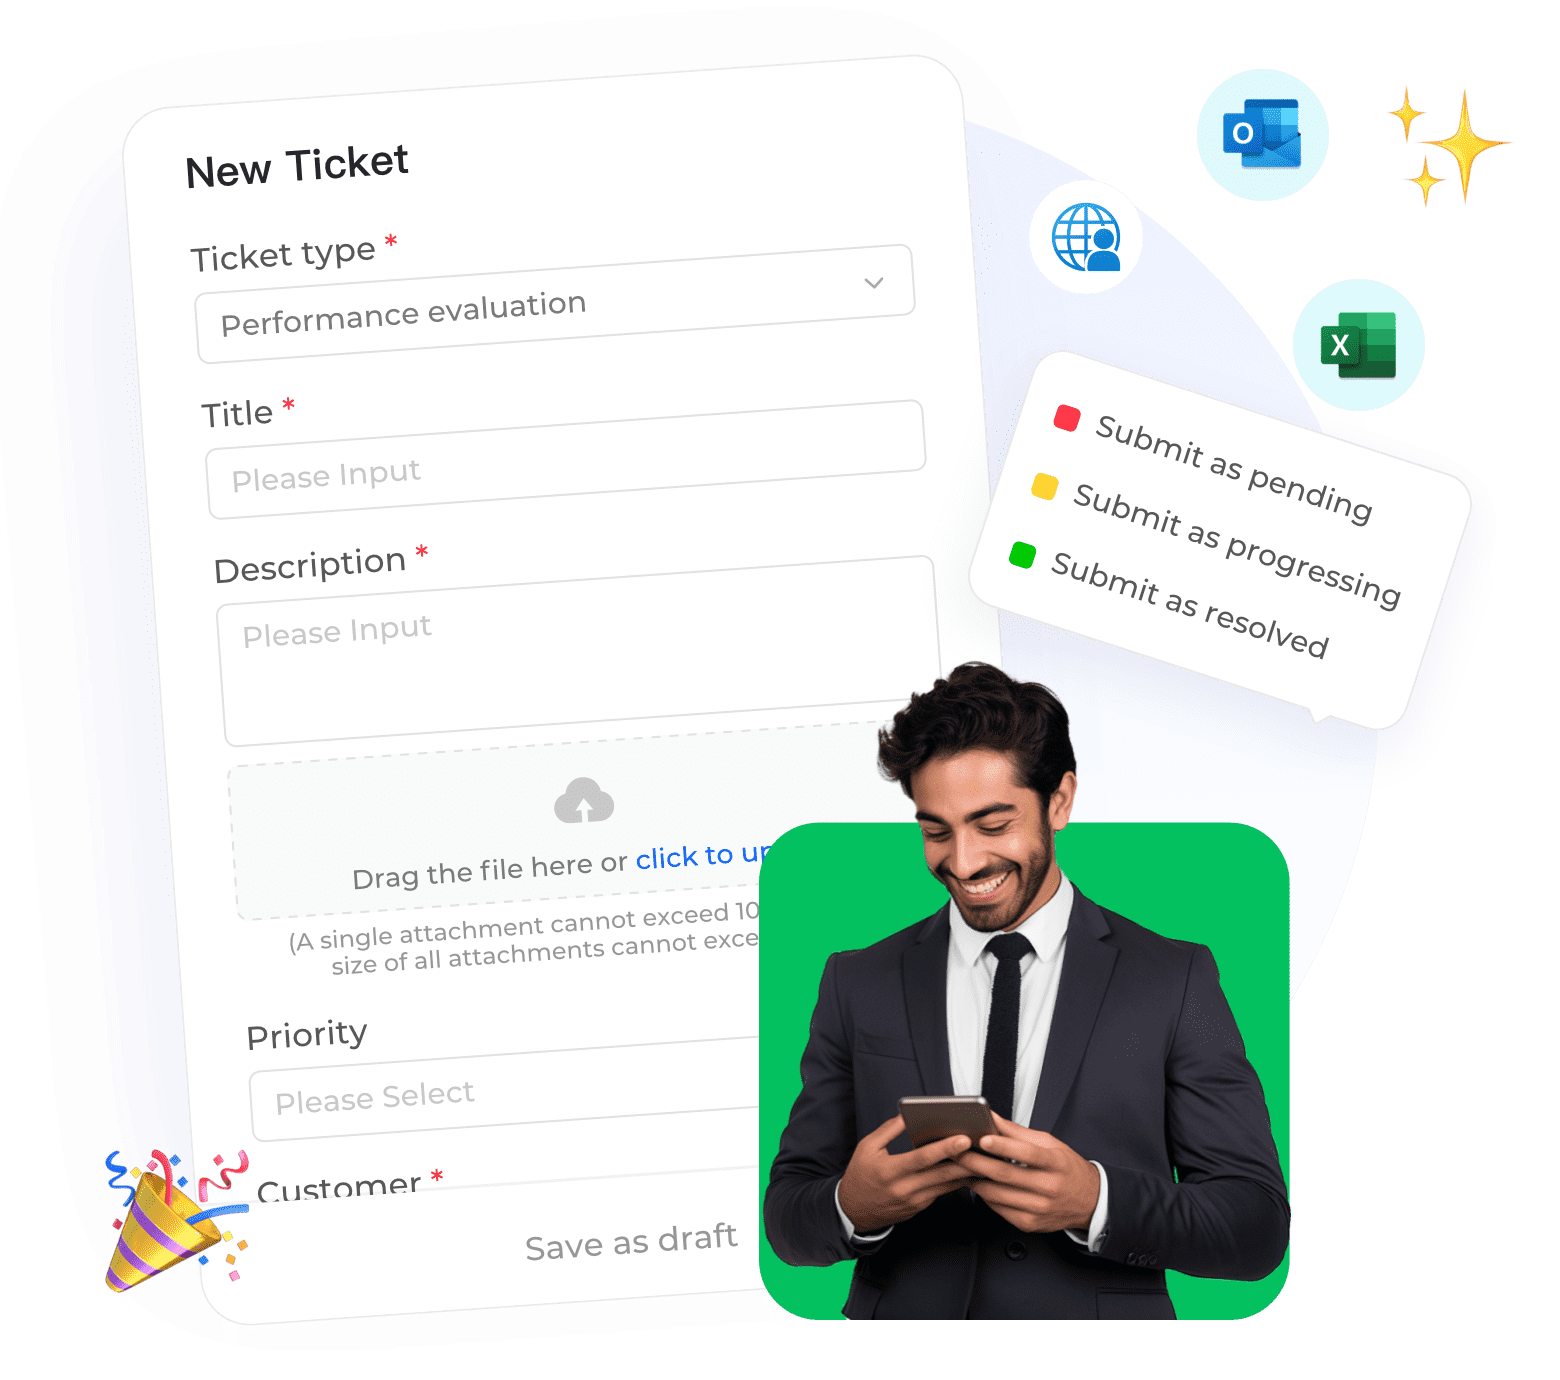
Improving customer engagement metrics doesn‘t always require more headcount. Sometimes it means giving your team better tools to work faster and smarter. A well-designed ticket system helps by centralizing conversations, automating routine tasks, and giving agents a complete view of each customer’s history.
Instadesk Ticket System is built for this. It centralizes email, chat, and social media inquiries into a single workspace, automatically converting customer messages into trackable tickets. Agents see the full context of every conversation without switching between screens. That means faster responses, shorter resolution times, and customers who feel heard.
When your support operation runs smoothly, customers notice. They stay longer, buy more, and tell others about their experience. That’s what customer engagement metrics are supposed to measure — not just activity, but real relationships that drive growth.